Prismatic Launches New Executions Experience to Help Teams Diagnose Integration Issues Faster
PR Newswire
SIOUX FALLS, S.D., Oct. 1, 2026
Execution sections bring step-by-step visibility to code-native runs laying the foundation for AI-assisted debugging, while rebuilt list and detail views make it faster to troubleshoot executions
SIOUX FALLS, S.D., Oct. 1, 2026 /PRNewswire-PRWeb/ -- Prismatic, the AI-enabled embedded iPaaS for B2B SaaS companies, today announced execution sections for code-native integrations (CNI) and a rebuilt executions experience. Execution sections give code-native integrations the step-by-step visibility already available for low-code integrations. Developers name the parts of their integration logic, and everyone who supports the integration sees which parts ran, which one failed, and the logs for each. Alongside it, rebuilt list and detail views make any run, code-native or low-code, faster to find and diagnose.
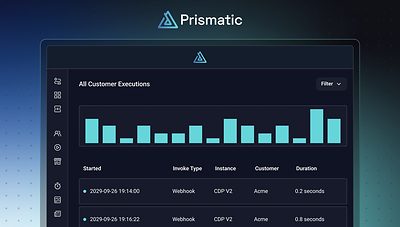
Until now, a code-native integration ran as a single step. When it failed, the app showed one error and whatever the developer had logged, so troubleshooting usually went back to the person who wrote the code. That visibility gap is a reason some teams hesitate to move to code-native, even when it is the faster way to build. Execution sections narrow it.
The executions page is already where teams go when a live integration breaks. A query builder finds the run behind a customer report by filtering on the trigger payload, such as an order number, and stacks conditions to isolate a pattern. A chart of successes and failures sits above the results, and clicking a bar narrows the list to that window. Open any run, and the error is stated up front, with logs and payload beneath it.
"Moving to code should never mean giving up visibility," said Michael Zuercher, CEO and co-founder of Prismatic. "Execution sections make a code-native run readable to the whole team, and because code-native runs can now have structure, they become the foundation for AI that can read an execution and tell you what went wrong."
Structure for code-native integrations
With execution sections, developers give parts of their integration logic plain names, such as "Sync EMEA" or "Fetch files," using the Prismatic SDK. The detail view then shows the run as an ordered list of those sections with status, timing, and logs. Support and operations teams can see which section failed and open its logs, and developers see the same structure while they build and test. Sections are opt-in and require the latest version of the Prismatic SDK.
Find the right execution
The list view is built for filtering and triage across every customer, instance, and flow in an organization. Teams can filter by trigger payload to find the execution tied to a specific customer record, such as an order number; filter by flow across every instance it is deployed to; narrow by status and date range; and combine conditions to isolate a pattern. A chart above the results shows successes and failures over time. Once teams fix the underlying issue, they can select the affected executions and replay them together instead of one at a time.
Understand what happened and why
The detail view now gives each execution a dedicated page. It starts with a plain-language error, followed by a timeline of each step the execution took. Teams can expand any step to see its logs and output, view the trigger payload, replay the execution, and share a link to the run with a teammate who needs to pick it up.
The release builds on visibility work Prismatic shipped earlier in 2026, including execution health charts across the app and faster log search over the full 14-day retention window. Together, they let teams see whether failures are increasing, which integration or customer is driving them, and what happened in a single run.
Execution sections and the new list and detail views are now available at no additional cost. The list and detail views work for both code-native and low-code integrations.
To learn more, read the launch post or visit prismatic.io.
About Prismatic
Prismatic is the AI-enabled embedded iPaaS for B2B SaaS companies, the foundation for product extensibility. It brings productized integrations, embedded workflows, and agentic interaction together on one core platform that handles everything that breaks at scale: authentication, deployment, monitoring, security, and compliance. Developers build and ship integrations 10x faster with code-first development and AI coding assistants. Customers build the workflows their business needs through embedded, white-labeled tools. And AI agents get the tools to take action across any connected system. Used by Fortune 500s and high-growth startups alike, Prismatic turns integrations from a bottleneck into a growth driver. Learn more at prismatic.io.
Media Contact
Brian Franklin, Prismatic, 1 8883055453, press@prismatic.io, https://prismatic.io/
 View original content to download multimedia:https://www.prweb.com/releases/prismatic-launches-new-executions-experience-to-help-teams-diagnose-integration-issues-faster-302894186.html
SOURCE Prismatic

